Analyzing Packets
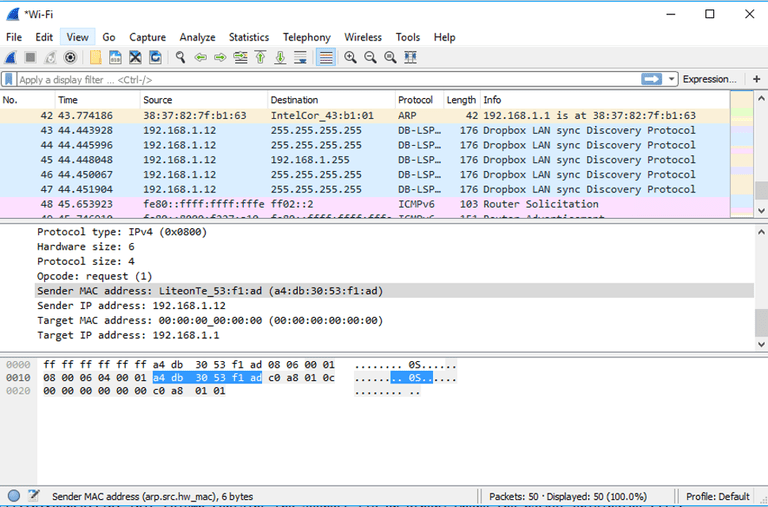
Now that you've recorded some network data it's time to take a look at the captured packets. As shown in the screenshot below, the captured data interface contains three main sections: The packet list pane, the packet details pane, and the packet bytes pane.
There are three windows in Wireshark:
- The traffic window which shows the packets in order of receipt.
- The packet window which shows the packet (and frame) breakdowns of the selected packet from the traffic window.
- The hexdump window which shows the raw bytes of the highlighted section highlighted in the packet window.

Packet List
The packet list pane, located at the top of the window, shows all packets found in the active capture file. Each packet has its own row and corresponding number assigned to it, along with each of these data points.
- Time: The timestamp of when the packet was captured is displayed in this column, with the default format being the number of seconds (or partial seconds) since this specific capture file was first created. To modify this format to something that may be a bit more useful, such as the actual time of day, select the Time Display Format option from Wireshark's View menu - located at the top of the main interface.
- Source: This column contains the address (IP or other) where the packet originated.
- Destination: This column contains the address that the packet is being sent to.
- Protocol: The packet's protocol name (i.e., TCP) can be found in this column.
- Length: The packet length, in bytes, is displayed in this column.
- Info: Additional details about the packet are presented here. The contents of this column can vary greatly depending on packet contents.
When a packet is selected in the top pane, you may notice one or more symbols appear in the first column. Open and/or closed brackets, as well as a straight horizontal line, can indicate whether or not a packet or group of packets are all part of the same back-and-forth conversation on the network. A broken horizontal line signifies that a packet is not part of said conversation.
Packet Details
The details pane, found in the middle, presents the protocols and protocol fields of the selected packet in a collapsible format. In addition to expanding each selection, you can also apply individual Wireshark filters based on specific details as well as follow streams of data based on protocol type via the details context menu – accessible by right-clicking your mouse on the desired item within this pane.
Packet Bytes
At the bottom is the packet bytes pane, which displays the raw data of the selected packet in a hexadecimal view. This hex dump contains 16 hexadecimal bytes and 16 ASCII bytes alongside the data offset.
Selecting a specific portion of this data automatically highlights its corresponding section in the packet details pane and vice versa. Any bytes that cannot be printed are instead represented by a period.
You can choose to show this data in bit format as opposed to hexadecimal by right-clicking anywhere within the pane and selecting the appropriate option from the context menu.